
Abortion policy and freshman migration, 2018 and 2020

The recent SCOTUS ruling overturning Roe v. Wade has set off an interesting debate about student college choice.  People who favor legal access to abortion seem convinced that students--especially women--will change their college plans based on the climate in the state of the college(s) they're considering.

Will it?  I don't know.  I do know that when everyone seems to be convinced of something related to college admissions and student choice, the reality is often very different than the predictions, after all is said and done.  And on the other hand, this feels different, somehow.  To repeat: I don't know.

Of course, the ability of students to migrate across state lines is generally reserved for those with more wealth and privilege, and as I've demonstrated before (here and here), educated and wealthier communities tend to vote Democratic, and thus, are more likely to be pro-choice and more likely to be upset by the SCOTUS decision.  And I, like a lot of people, live in an echo chamber and mostly listen to people who share my political beliefs (which is also why I haven't heard from my brother since November, 2020.  But that's another story.)

Additionally, politics is probably already a factor in college choice for those students who can move out of state, and those who go to institutions with more conservative religious affiliations, like BYU, or Notre Dame, or Grove City.  Finally, not everyone is political, and not everyone disagrees with the SCOTUS ruling.

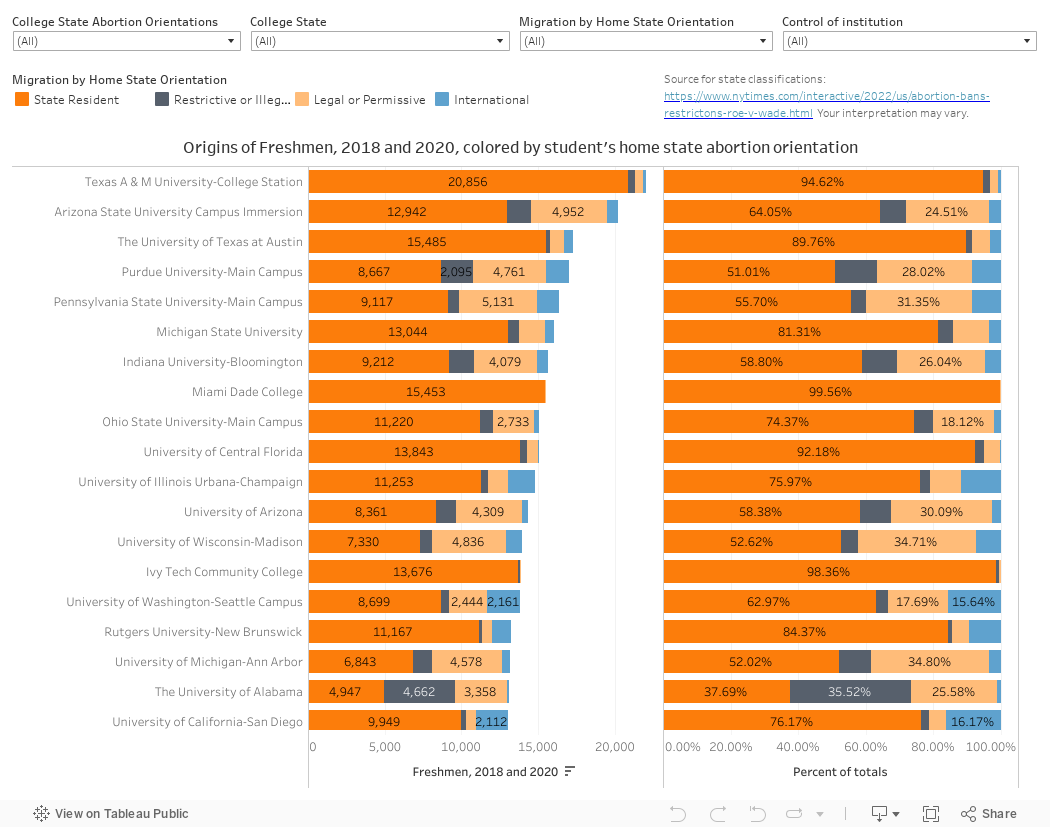
But I still wanted to look at the data, so here it is in a single view.  I looked at freshman migration in 2018 and 2020 to smooth out some of bumps that might be a result of COVID in 2020.  And before you ask, IPEDS only requires this data to be reported in even-numbered years, so we won't have 2022, let alone 2024, for a long time yet.

I broke down a college's freshman classes into four categories: State residents (the state breakdown tab here shows that about 79% of students attend college in their home state); international students, students from states with mostly unrestricted abortion laws, and students with more restrictive abortion laws.  Counts are on the left; percentages on the right.  I used the classifications here in case you were wondering, so argue with the New York times if you don't agree.

What do you see here?  Leave a comment below or hit me up on Twitter

Comments

Popular posts from this blog

Educational Attainment and the Presidential Elections

I've been fascinated for a while by the connection between political leanings and education: The correlation is so strong that I once suggested that perhaps Republicans were so anti-education because, in general, places with a higher percentage of bachelor's degree recipients were more likely to vote for Democrats. The 2024 presidential election puzzled a lot of us in higher education, and perhaps these charts will show you why: We work and probably hang around mostly people with college degrees (or higher).  Our perception is limited. With the 2024 election data just out , I thought I'd take a look at the last three elections and see if the pattern I noticed in 2016 and 2020 held.  Spoiler: It did, mostly. Before you dive into this, a couple of tips: Alaska's data is always reported in a funky way, so just ignore it here.  It's a small state (in population, that is) and it's very red.  It doesn't change the overall trends even if I could figure out how to c...

Changes in AP Scores, 2022 to 2024

Used to be, with a little work, you could download very detailed data on AP results from the College Board website: For every state, and for every course, you could see performance by ethnicity.  And, if you wanted to dig really deep, you could break out details by private and public schools, and by grade level.  I used to publish the data every couple of years. Those days are gone.  The transparency The College Board touts as a value seems to have its limits, and I understand this to some extent: Racists loved to twist the data using single-factor analysis, and that's not good for a company who is trying to make business inroads with under-represented communities as they cloak their pursuit of revenue as an altruistic push toward access. They still publish data, but as I wrote about in my last post , it's far less detailed; what's more, what is easily accessible is fairly sterile, and what's more detailed seems to be structured in a way that suggests the company doesn...

The Highly Rejective Colleges

If you're not following Akil Bello on Twitter, you should be.  His timeline is filled with great insights about standardized testing, and he takes great effort to point out racism (both subtle and not-so-subtle) in higher education, all while throwing in references to the Knicks and his daughter Enid, making the experience interesting, compelling, and sometimes, fun. Recently, he created the term " highly rejective colleges " as a more apt description for what are otherwise called "highly selective colleges."  As I've said before, a college that admits 15% of applicants really has a rejections office, not an admissions office.  The term appears to have taken off on Twitter, and I hope it will stick. So I took a look at the highly rejectives (really, that's all I'm going to call them from now on) and found some interesting patterns in the data. Take a look:  The 1,132 four-year, private colleges and universities with admissions data in IPEDS are incl...