Two quick additions/clarifications to this: The definition of full-pays is those students who receive no institutional funds. EM people don't care where the cash comes from, only the discount. Second, yes, I know some institutions use endowments to pay for institutional aid. That percentage is likely very small, although concentrated at a few institutions.
Before we begin, here is what this post does not do:
- It will generally not tell you where you can get low tuition, with a very few exceptions. And when it does, it won't be at one of "those" colleges.
- It will not tell you which colleges are likely to close soon, although after the fact, you can probably find a closed college and say, "Aha! Right where I expected it would be!"
- It will not show you net costs to students.
- It will not adjust for things like church support, enormous endowments, or the cost of living in that high-priced city where Excellence College or Superior University is located.
Got it? Good.
This will show you the discount rate on first-year students at about 1,000 four-year, private, not-for-profit colleges in 2021-22. Discount as I define it is the total unfunded institutional financial aid divided by the total charged (gross) tuition and fees. A university that charges (published tuition and fees times the number of students) $10,000,000 and awards $4,000,000 in aid has a discount rate of 40%. At most colleges, this discount is simply an accounting transaction, much like a coupon to save a dollar on a sandwich at Subway. That, of course, is a gross over-simplification of the "what" of discounting, and it doesn't touch the "why" of discounting at all. But if you want an explanation, I'll gladly talk to your trustees for a reasonable fee.
And there is a difference between discount and net revenue, although at any given tuition charge, the two are perfectly related. Unfortunately, as you'll soon, see, colleges all set their own tuition. To wit:
- A college charging $50,000 with a 20% discount has net revenue (the cash you can spend) of $40,000 per student.
- That same college with a 50% discount has just $25,000 per student.
- A college charging $30,000 with a 10% discount has $27,000 per student.
- That same college with a 40% discount has $18,000 per student.
As a college, you don't care where the cash comes from: Pell grants, state grants, loans, or the student's family. This means, hypothetically, a student with low institutional aid might pay less than one with more aid. Confused? Good.
If you use this with your trustees to explain your own college's market position, consider supporting my costs of time, hosting and software by buying me a coffee. Just click here to do so. If you counsel high school students, or your a parent of a prospective college student, must keep reading and don't feel any obligation at all.
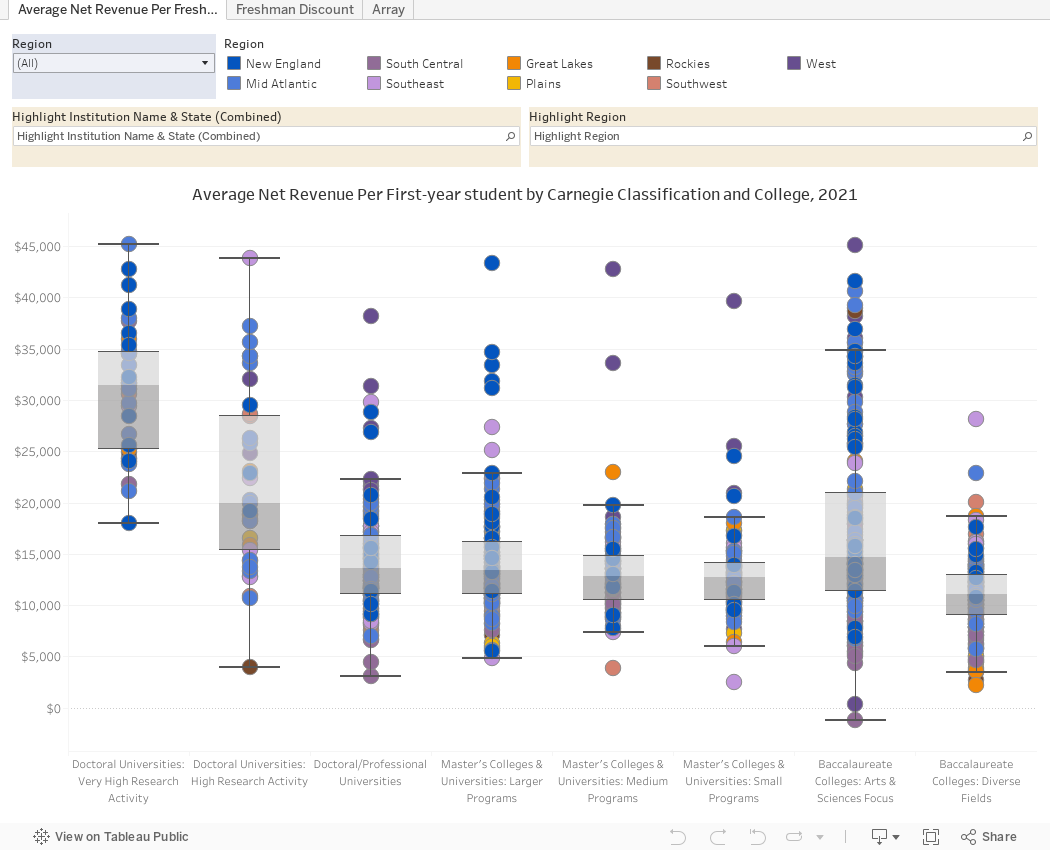
Here is the data, in three views. The first two are box and whisker plots, where half of the colleges fall inside the gray box on each column to show you the middle 50%.
The first view shows net revenue per freshman student, arrayed by the institution's Carnegie type. Use the controls to filter region, highlight region, or highlight an individual college. To do the latter, type any part of the name in the box, hit enter, and select from the options. Hover over dots for details; each dot is a college.
The second view is identical, but it shows discount rate, the number people obsess over while missing the more important net revenue figure.
The third view shows those two values arrayed, with the same highlighters, allowing you to filter on Carnegie type, or even the percentage of the students who are full-pay (that is, they get no institutional aid at all.)
You'll soon see that discount and net revenue don't seem to be big issues at the big name, strongly endowed institutions. That's because, at many of these places, undergraduate education is essentially a sideline business, and only a minor source of revenue. The money they bring in (or don't) on this presumably core function of the university is managed to best optimize to reputation or selectivity, or other factors (including, sometimes, mission).
Note that I've done my best to remove some outliers with wild data that throw the charts off. Many of these are colleges I have never heard of, and they're tiny. Others are places with strong religious missions (like Yeshivas or Seminaries) that may be externally funded in ways this can't account for.
Enjoy
Comments
Post a Comment