This is a sort of a lull for Higher Ed Data Stories. It's summer, for one, and the data release cycles have not yet geared up.
So instead, I want to write about the ten things that would make it easier to produce HEDS on those occasions when there is good data to work with. You know I use Tableau to create the data visualizations you find here. It's been a tool that has changed my career: The value of being able to answer questions with a click (especially when you're in a room with someone up the hierarchy and that person is doing the asking) can't be overstated.
The original vision of Tableau--To allow people to see and interact with their data--was made just for people like me: Interested, a bit curious, but not especially technically proficient. I owe a lot to the company (and there are probably at least 25 colleges who got introduced to Tableau through my early excitement about the product, so maybe they owe me a bit, too, even though I know Higher Ed is not a huge vertical for them.)
Still, you get so far with the first five or six actions in Tableau, it might seem unfair to ask for more. But these things end up being the 90/10 factor in so much of my work, I think a little investment in fixing them would create big gains for everyone. And before I begin, I realize there are hacks that make many of these things possible; that's not the point. I want them to be as easy as the rest of Tableau is.
So, here are the Top Ten Things I Wish Tableau Would Announce:
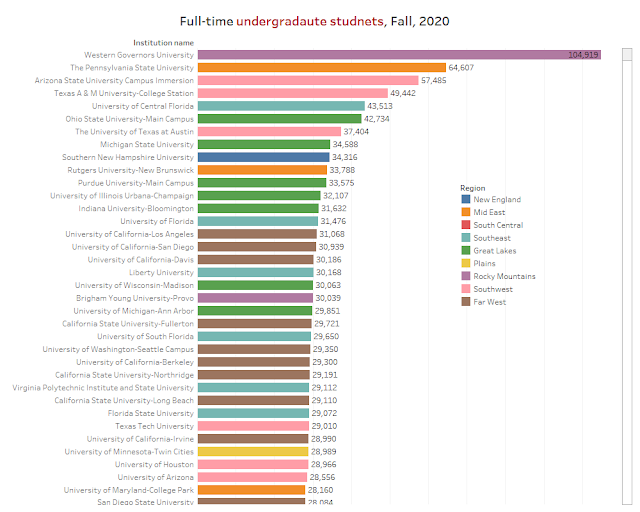
10. Better Sorting for Viewers
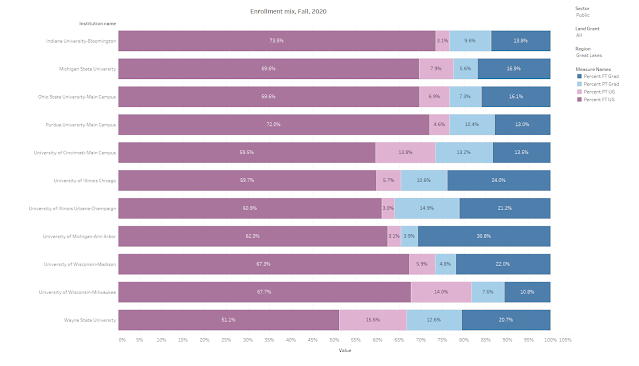
Here is a stacked bar chart showing enrollment mix (full- and part-time; grad and undergrad) at public R1 universities. It would be great if you could sort top to bottom by any variable on the bars (the university with the highest percentage of full-time graduate students, for instance.) The work-around for this requires parameters and formulae that are way too complex for the average user. Compare it to how easy it is to sort a single variable on a bar chart, and you know what I mean.
9. Auto "Standard" or "Fit" Sizing based on records in the view
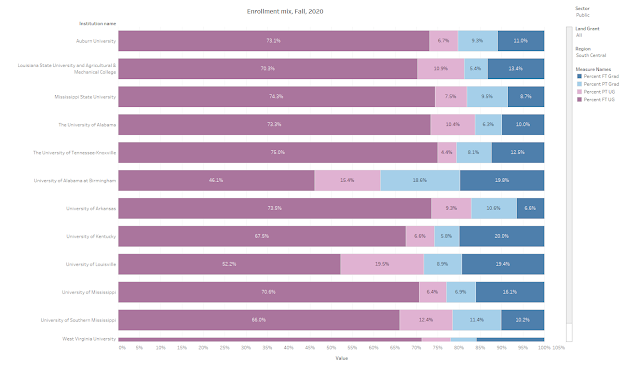
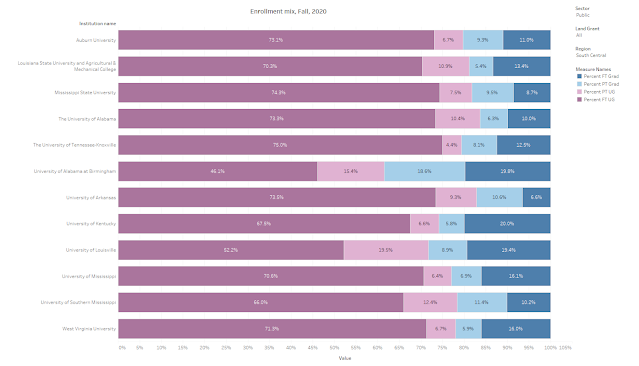
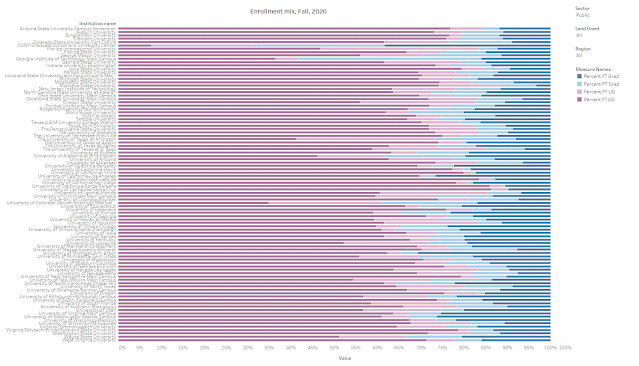
Using the same work book, and the example above, notice that the bars nicely fill the chart. This is an accident using "Standard" sheet sizing, based on the "Great Lakes" region. If I switch to "South Central" they don't all fit in one view.So you're left with a choice: Set the sheet to "Fit Height" which works great for some regions (same filter but Fit Height selected):
But not so great when you select all.
Again, this can be done sheet swapping via a SIZE formula but you need to create multiple sheets to do it, and the formula (Don't not select if Not Null or something about as silly) doesn't seem to be as easy as it could be. Please make this easier, Tableau.
8. Color palettes on the fly
Just let us create a color palette on the fly and save them. There is no rational reason we should need to go into a text file, edit it, save it, and restart.
7. Start the view with a Blank Measure Values Shelf
If I want to do Measure Values on three of my 75 variables, why can't I just drop them onto a shelf? Why do I have to double click to add them all and then remove them?
6. Better bins
Binning is a great feature, but it's also way too rigid. I may not want GPAs of incoming students after one year to be in increments of a quarter point. I may want to break that variable into "Under 2.0 and the increments of .25 above 2.0. Look at how easy SPSS (not the most innovative software on the planet) did this 20 years ago using variable cut point. And while I have your attention, the labels created for bins are pretty bad, too.
5. Create an ID per row
Sometimes data comes in without IDs. Can we just click a button and create a dummy ID for each row? That would be great.
4. Better labels for parameters
If I create a parameter to show different types of values (show percent, or counts) let the label format follow the original variable. Again, thanks to Andy Kriebel I know there is a hack to this, but it takes a long time, and should just be a click.
3. Format multiple controls at once
I know. I've been told I use too many filters, but at a university, everyone wants to look at their data, and not much else. Take a look at this enrollment dashboard I create for internal use. Everyone has different questions of it, so it has a lot of filters. Each one takes several clicks to choose filter type, apply to all on dashboard, include/exclude, etc. I can choose a color for the filters all at once; why not functionality?
2. Better tool tips
If nothing else, let us choose a default style from several. And let us use any field in the data, even if it's not on the view. Fix the chart-in-tool tip so it's smarter.
1. Spell check
I'm a horrible speller and I don't even see that "undergraduates" is spelled incorrectly (although I do notice "studnets." Spell check is old technology. Please fix this.
I'm not a groupie by nature, but Tableau is the best and most game-changing software I've ever used. I just want more people like me to be able to use it and get the results they want without creating a lot of parameters, formulae, and hacks to help get information into the hands of people who want to see it.


Comments
Post a Comment