There is almost nothing that enrollment managers and CFOs and trustees talk about at private universities these days more than discount rates. Because, as I wrote recently, colleges are not-for-profits, but they're not charities; they need revenue to keep the business running because electric bills, faculty salaries, and test tubes are all paid for in cash.
And while I no longer work at a private university, this is still important because the financial health of one sector affects all other members of the industry in some way. This is important information for you to know.
Discount rate determines how much cash you actually receive from each student after you award institutional financial aid. If you understand discount, you can skip over the blue section below and go right to the explanation of the visualization. If not, here's how EM people think about it. Don't worry if you're confused; it is a difficult concept to understand.
You charge a tuition. And you offer scholarships. Most, if not all, of that scholarship money is unfunded, i.e. it is discount off of tuition. When you charge $40,000 and offer a student a $10,000 scholarship, you are really just saying, "We're setting our price at $30,000 for you."
The accountants do this by booking $40,000 in gross revenue and $10,000 in discount. And you do that for each student you enroll. Some will get no discount (0%), and some might get full discounts (100%). Some might get more (for instance if you give someone a full tuition, room, and board scholarship, the value might be $60,000 on $40,000 of tuition, or 150%, which is generally not a good business model if you do it too often). But if you add up all the gross revenue, and add all the discount, then do discount/revenue you get a discount rate.
For instance, you enroll 1,000 students at $40,000 tuition. Your gross revenue is $40,000,000. Your total discounted aid budget is $12,000,000, so your discount rate is 12/40 or 30%. If your aid budget goes up to $15,000,000, your discount rate would be 37.5%. In the first scenario, your net revenue is $28,000,000; in the second it's $25,000,000 and your average net revenue is $28,000 or $25,000 respectively.
Discount used to be purely an accounting function, something calculated after all the students were enrolled and the year was over. That made sense, because things were mostly very stable, and competition was low, and prices at colleges were not inflated.
But people started managing to discount rate when things started getting crazy: That is, it was set as a target for EM people to hit. In my opinion, this is not a great idea because of Campbell's Law, which says you can hit almost any target if you don't care about the things that go into making that number in the first place. The challenge in EM is that a lot of factors that go into making a class are tied together, but when someone says "lower the discount" they implicitly mean "without changing anything else."
For instance, you can lower discount by reducing the number of students you enroll, and only admit those with the most ability to pay and the greatest willingness to do so. Unfortunately, these are often among the weakest students in the pool. So, yes, quality and quantity may go down, but hey, I hit that discount number! (This is an absurd example of course, done only for the purposes of demonstration).
Discount is pretty much irrelevant. There, I said it. If you raise tuition faster than inflation, and increase your discount, you can still generate more cash each year because, well, algebra. Here is a presentation I did several years ago, in case you want to dive into this more fully. Discount is an algebraic equation, and it's not as important as net revenue per student.
It is important not to confuse discount and net revenue from the college side with net price on the student side. The college does not care where the balance of tuition comes from once they've applied the institutional discount: It can come from Pell, student loans, parental savings, outside scholarships (or even funded scholarships managed by the university). Cash is cash.
The student, of course does care. If two students have a $40,000 tuition and a $10,000 scholarship, the net cost to one could be $30,000 from a check mom and dad write; the net cost to the other could be zero due to state or federal grants or outside scholarships. From a discount standpoint, they look identical. From a net cost standpoint, they're very different.
Got it? Good. Now you can go on to look at the discount data.
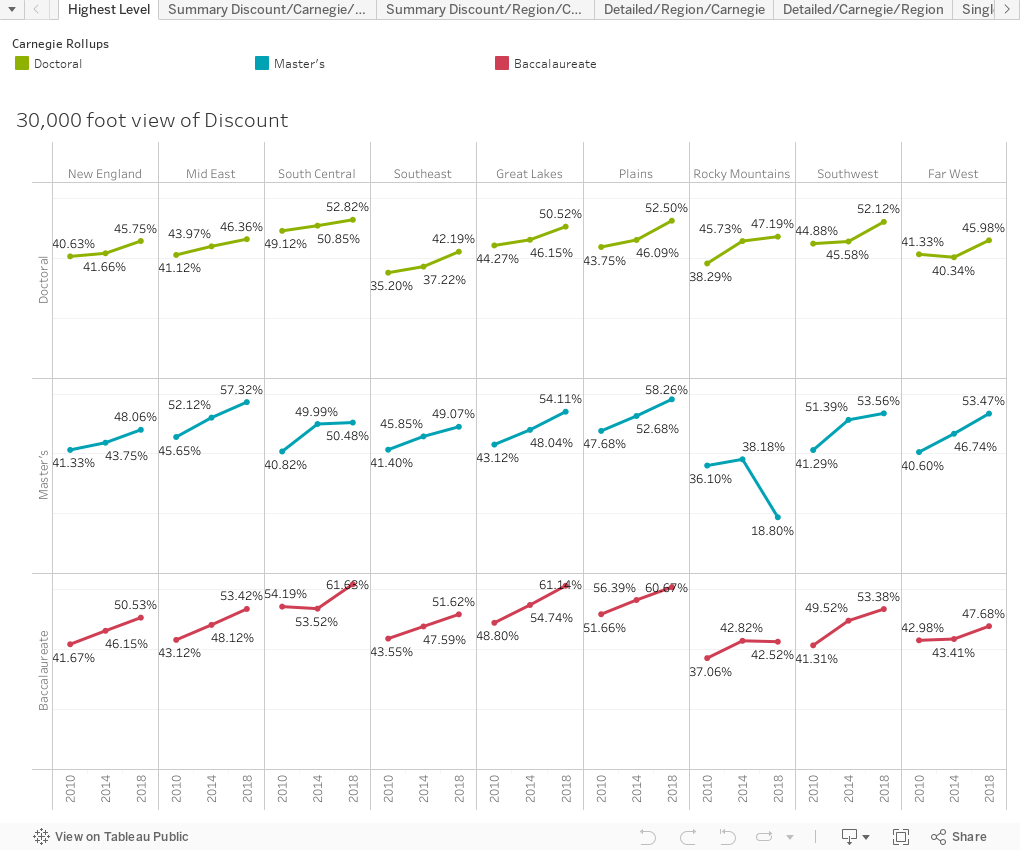
There are seven views here.
- Highest level shows discount rates in 2010, 2014, and 2018, by region and broad Carnegie type. I only included Doctoral, Master's, and Baccalaureate colleges and universities here because small numbers on some of the other categories skew things a bit. Special focus business and engineering colleges are included elsewhere.
- Summary Discount/Region/Carnegie shows weighted averages by region and allows you to filter to specific Carnegie types.
- Summary Discount/Carnegie/Region is the same data, but broken out by Carnegie type first, with a region filter.
- Detailed Region/Carnegie arrays each individual college (a dot) on the y-axis by discount each year. It splits by region and then allows filtering by Carnegie. It also displays a box-and-whisker plot over the data to calculate boundaries. You can find an individual college by using the highlight function. Just start typing the name of the college you want to highlight and select it when you see it.
- Detailed Carnegie/Region is the same, but split by region first with a Carnegie filter.
- Single institution shows raw numbers for admissions and financial aid over time.
- Net Revenue per freshman is the important one, after all is said and done. It shows how much cash a college generates for each freshman enrolled. This is [(gross tuition-institutional aid)/(number of students)].
- It's based on IPEDS, and IPEDS is compiled by humans and humans make mistakes, and sometimes don't understand the data definitions perfectly. This is for fun and entertainment. Don't make any important strategic decisions thinking this is precise.
- I am assuming most institutional aid is unfunded, but I can't tell. If you want to know why that matters, go back and read the blue section. Funded aid is cash, and just like Pell or Student Loans or external scholarships, you don't care about the source of the cash as long as it's not foregone revenue. (Imagine you're Subway: A discount is a $3 off a footlong subway coupon; it's different than if someone gave your customer $3 in cash to buy a sandwich.)
- This includes tuition but not fees. Both are interesting calculations, but they don't change things a lot in the whole scheme of things.
- There are a few outliers with unique circumstances (Antioch, Berea, Webb) at both ends of the spectrum. Don't let those distract you.
- I went to Catholic school. I'm a lousy speller. And a poor proofreader. However, let me know if you spot any problems with conventional spelling.
- I don't do requests. I know someone would love to see the relationship between increasing discount and selectivity. I'll send the data to anyone at a not-for-profit who wants it, so you can do your own analysis.
Comments
Post a Comment