IPEDS just released Fall, 2017 Admissions data, and I downloaded it and took a quick look at it. If you've been here before, most of this should be self-explanatory.
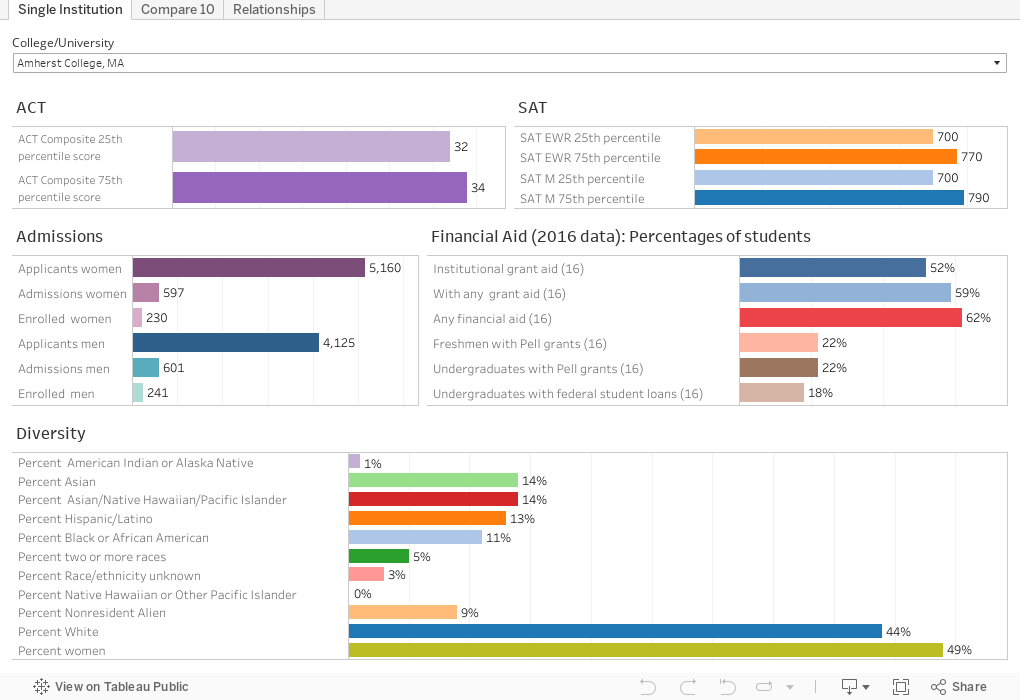
Three tabs, here: The first is to take a look at a single institution. Use the control at top to select the college or university you're looking for. (Hint, type a few letters of the name to make scrolling quicker).
The second tab allows you to compare ten (you can do more, but it gets messy). I started with the ten most people want to see, but you can delete them by scrolling to their check in the drop down and deleting them, and clicking apply. Add institutions by checking the box by their name.
The final shows the relationships between test scores and Pell, which I've done before, but I never get tired of. Choose SAT or ACT calculated means for the x-axis, then limit by region and/or control if you so desire.
Notes:
1) Some of the admissions data for 2017 is tentative, so anomalies are probably in error.
2) Test-optional colleges are not allowed to report test data
3) Financial aid data is for 2016, as the 2017 data is not yet available. It tends not to change dramatically from one year to the next, however.
Comments
Post a Comment