There is no problem so great that it can't be solved by enrolling more full-pay students, it seems. And in the minds of some, there is no solution so frequently tossed out there. I've heard several presidents say, "We're doing this to attract more full-pay students."
Before we dive too deeply into this, a definition: A "Full-pay" student is not one who receives no aid; rather it's one who receives no institutional aid. Often these overlap considerably, but a student who receives a full Pell and/or state grant, and then takes out a PLUS loan is a full-pay; all the revenue to the college comes in cash, from another source, rather than its own financial aid funds. The source of that cash matters not to the people who collect the tuition. Got it?
This is a fairly deep dive into the IPEDS 2015 Fall Freshman data (there is 2016 admissions data, but financial aid data is only available for 2015-2016, so I used that admissions data to line things up.) It's safe to say that things may have gotten slightly worse for most colleges since then, but there may be places where it's gotten better. Discount at public institutions is less meaningful, so I've only included about 900 four-year, private, not-for-profit institutions from Doctoral, Masters, and Baccalaureate institutions with good data.
Eight views here: The first four are overviews, the next three are details within the larger context, and the final view is single institutions. Colleges are banded into groups by selectivity in Fall, 2015, with more selective on the left, moving to the right. Those groups are labeled "Under 15%," meaning the admit rate was under 15% in 2015; !5% to 30%, etc. Open Admission at the right simply means the college generally admits all applicants, and is not required to report admissions data to IPEDS,
Ready? Use the tabs across the top to navigate.
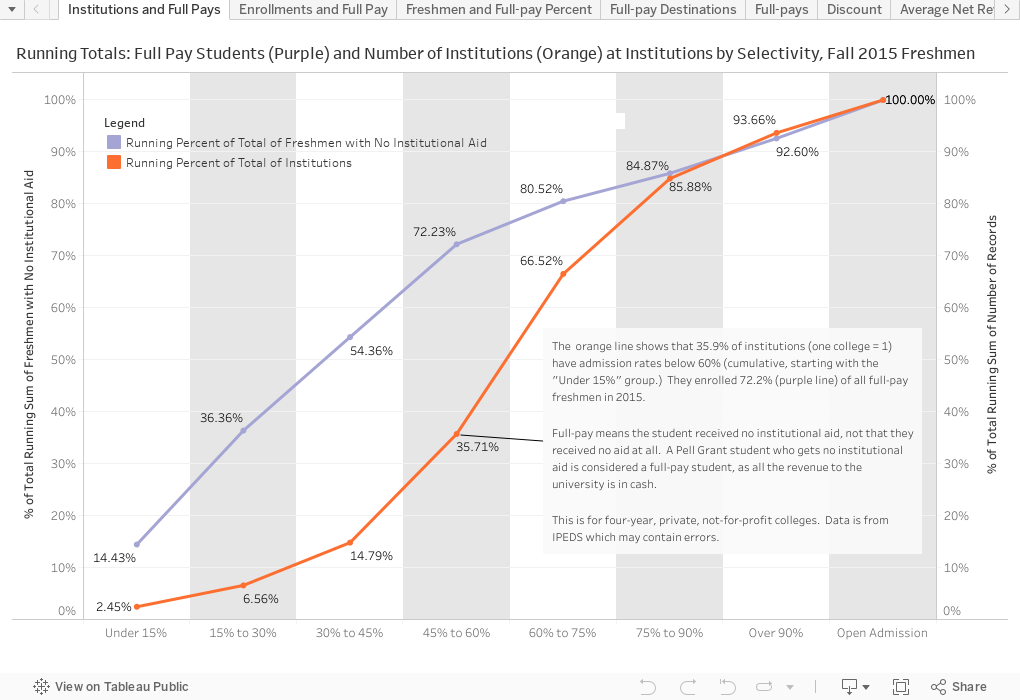
1) Institutions and Full Pays: Looking colleges by selectivity, what percentage of institutions fall into each group, and what percentage of full-pay students attend. The orange line shows that 2.45% of colleges are in the most selective group, but 14.43% of full-pays (purple line) enroll there. Sums accumulate to the right.
2) Enrollments and Full Pay: Similar data, except now the red line shows what percentage of freshman overall are enrolled in these institutions. For instance, 5.27% of all freshmen, but 14.43% of all full-pay students, enroll in the under 15% group. This also shows running percentages, so by the time you get to all colleges up to and including 45% to 60%, the numbers are 73% and 81%.
3) Freshman and Full-Pay Percentages: These are discreet. The teal colored bar, for instance, shows only students in that category (135,381 freshmen) and the percentage of students in that group who are full-pay (4.9%).
4) Full-pay Destinations: Where do full-pay students enroll? This shows by region and selectivity, and you can filter to a single state if you'd like. It just shows Fall, 2015 raw numbers.
5) 6) and 7) are similar charts, with the only difference being the value displayed. In these three, dots represent a single institution, colored by region. They're grouped by selectivity (left to right position), and then the vertical position shows the value. Full-pays shows the percentage of full-pays in the 2015 freshman class. Discount shows discount rate (the sum of institutional financial aid divided by the sum of tuition and fees). Average net revenue shows just that, which is the actual cash a college generates per student. Use the highlight function to show a single college or highlight a region for comparison.
And finally, 8) Single Institution allows you to see those three variables for one institutions at once. The are colored by region. You can sort by any column just by hovering over the axis and clicking the pop-up icon. Sort descending by value, ascending by value, or alpha by name as you cycle through the clicks.
If your data are wrong, talk to your IR office. If all data are wrong, drop me an email as I may have made a calculation error. Otherwise, drop me a note and let me know what you think.
Before we dive too deeply into this, a definition: A "Full-pay" student is not one who receives no aid; rather it's one who receives no institutional aid. Often these overlap considerably, but a student who receives a full Pell and/or state grant, and then takes out a PLUS loan is a full-pay; all the revenue to the college comes in cash, from another source, rather than its own financial aid funds. The source of that cash matters not to the people who collect the tuition. Got it?
This is a fairly deep dive into the IPEDS 2015 Fall Freshman data (there is 2016 admissions data, but financial aid data is only available for 2015-2016, so I used that admissions data to line things up.) It's safe to say that things may have gotten slightly worse for most colleges since then, but there may be places where it's gotten better. Discount at public institutions is less meaningful, so I've only included about 900 four-year, private, not-for-profit institutions from Doctoral, Masters, and Baccalaureate institutions with good data.
Eight views here: The first four are overviews, the next three are details within the larger context, and the final view is single institutions. Colleges are banded into groups by selectivity in Fall, 2015, with more selective on the left, moving to the right. Those groups are labeled "Under 15%," meaning the admit rate was under 15% in 2015; !5% to 30%, etc. Open Admission at the right simply means the college generally admits all applicants, and is not required to report admissions data to IPEDS,
Ready? Use the tabs across the top to navigate.
1) Institutions and Full Pays: Looking colleges by selectivity, what percentage of institutions fall into each group, and what percentage of full-pay students attend. The orange line shows that 2.45% of colleges are in the most selective group, but 14.43% of full-pays (purple line) enroll there. Sums accumulate to the right.
2) Enrollments and Full Pay: Similar data, except now the red line shows what percentage of freshman overall are enrolled in these institutions. For instance, 5.27% of all freshmen, but 14.43% of all full-pay students, enroll in the under 15% group. This also shows running percentages, so by the time you get to all colleges up to and including 45% to 60%, the numbers are 73% and 81%.
3) Freshman and Full-Pay Percentages: These are discreet. The teal colored bar, for instance, shows only students in that category (135,381 freshmen) and the percentage of students in that group who are full-pay (4.9%).
4) Full-pay Destinations: Where do full-pay students enroll? This shows by region and selectivity, and you can filter to a single state if you'd like. It just shows Fall, 2015 raw numbers.
5) 6) and 7) are similar charts, with the only difference being the value displayed. In these three, dots represent a single institution, colored by region. They're grouped by selectivity (left to right position), and then the vertical position shows the value. Full-pays shows the percentage of full-pays in the 2015 freshman class. Discount shows discount rate (the sum of institutional financial aid divided by the sum of tuition and fees). Average net revenue shows just that, which is the actual cash a college generates per student. Use the highlight function to show a single college or highlight a region for comparison.
And finally, 8) Single Institution allows you to see those three variables for one institutions at once. The are colored by region. You can sort by any column just by hovering over the axis and clicking the pop-up icon. Sort descending by value, ascending by value, or alpha by name as you cycle through the clicks.
If your data are wrong, talk to your IR office. If all data are wrong, drop me an email as I may have made a calculation error. Otherwise, drop me a note and let me know what you think.
Comments
Post a Comment