Jerry Falwell, Jr., President of Liberty University, has just indicated that he will head a new task force to examine the Department of Education's policies on colleges and universities: Things like, "overreaching regulation” and micromanagement by the department in areas like accreditation and policies that affect colleges’ student-recruiting behavior, like the new “borrower defense to repayment” regulations," according to this report in the Chronicle of Higher Education (subscription required, but if you're in higher ed and you're not subscribing, you should. I've not been paid to endorse the Chronicle. Or anything, for that matter.)
Thousands of people on Twitter and in other social media have already pointed out why this is a bad idea, especially coming on what appears to be the approval of Besty De Vos as Secretary of Education. But if you want to see how far Liberty has taken recruitment, even under the current regulations that attempt to make admissions and recruiting more ethical, I challenge you to fill out the inquiry form on their website. Then count to ten, and I'm guessing you'll soon be connected to one of their friendly, helpful, sales agents who will tell you how you, too, can become a champion for Christ, and how you can use federal dollars to do so.
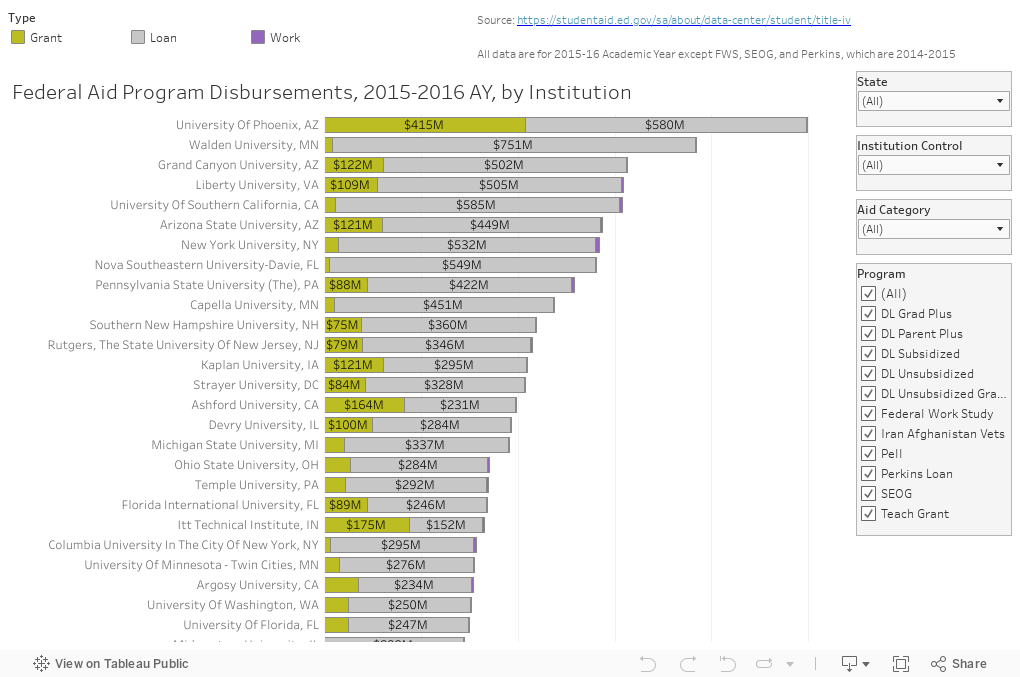
Here is how much federal aid Liberty students (and those from every other university receiving your tax dollars) received in 2015-16 (a few of the programs are 2014-2015, but they don't change much.) Interact to your heart's content.
And feel free to share this with your elected officials.
Thousands of people on Twitter and in other social media have already pointed out why this is a bad idea, especially coming on what appears to be the approval of Besty De Vos as Secretary of Education. But if you want to see how far Liberty has taken recruitment, even under the current regulations that attempt to make admissions and recruiting more ethical, I challenge you to fill out the inquiry form on their website. Then count to ten, and I'm guessing you'll soon be connected to one of their friendly, helpful, sales agents who will tell you how you, too, can become a champion for Christ, and how you can use federal dollars to do so.
Here is how much federal aid Liberty students (and those from every other university receiving your tax dollars) received in 2015-16 (a few of the programs are 2014-2015, but they don't change much.) Interact to your heart's content.
And feel free to share this with your elected officials.
Comments
Post a Comment