Last night, I gave a little demo of Tableau Software to graduate class, and tried to make the point that big, long, detailed spreadsheet reports are like a teenage daughter: The information you get sometimes seems like it's only given to meet the minimum requirement of reporting, not to allow you to extract any insight.
This seems to be true with the people at NACUBO, too, who each year release a study of endowment values and one-year performance. I'd encourage you to click on that link to see exactly what they provide. Not only is the document lacking any insight about trends of the shape of the market, it's boring. Most people will look at the top 15 or 20, and then go down the list to find institutions they know and make some comparisons.
Extracting the data is difficult, and even when you do, it's laden with characters that should be stripped off or cleaned up due to footnotes and other caveats. Moreover, there is no ID number attached to the colleges (like an IPEDS ID) so you can't merge other information into it to get real insight (like endowment to operating budget ratios, for instance). Still, I did the best I could, then visualized it. It's below.
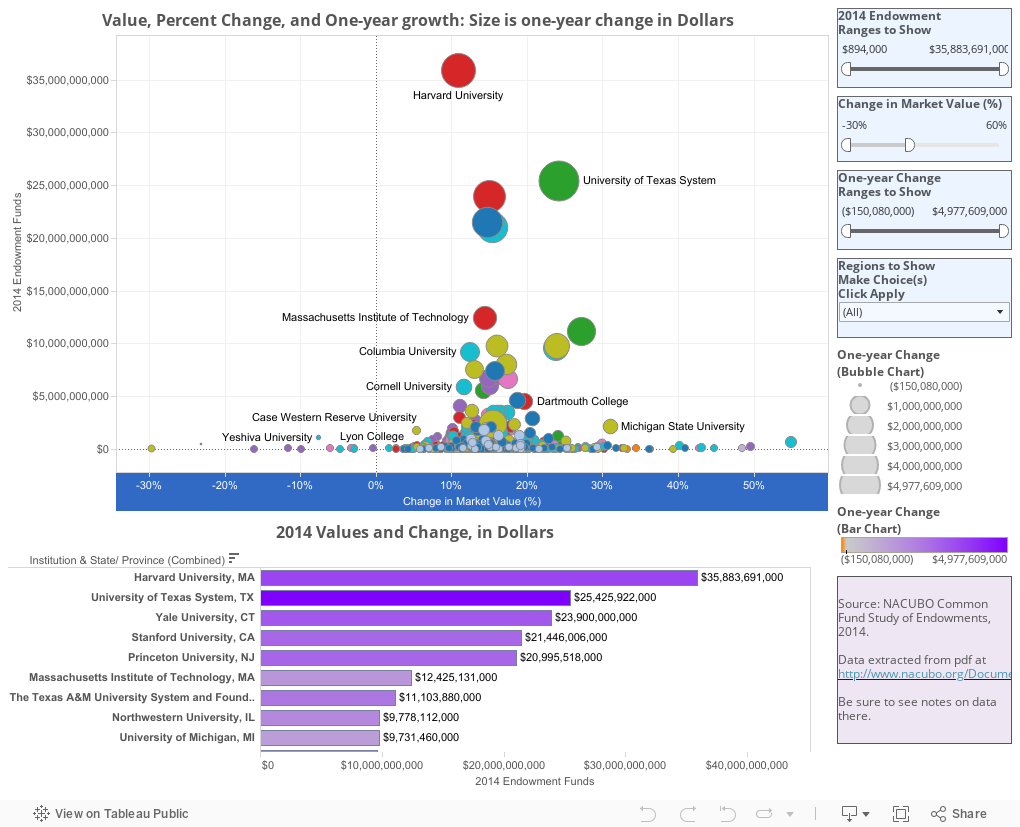
The top chart shows every university on two scales: 2014 Endowment value on the y-axis, and one-year percent change on the x-axis. They are duplicated on the bottom bar chart.
It gets fun when you use the filters: Eliminate the super-endowments, zoom in on big or small gains by dollar or percent; or use the regions to narrow the geographic view. (Note: One college had a 213% increase from 2013 to 2014. You can reveal it if you want by using the second filter. Pull the right handle all the way to the right.) You can't break it; I promise. But if you get stuck, you can always reset by clicking the small circular arrow at the bottom.
This seems to be true with the people at NACUBO, too, who each year release a study of endowment values and one-year performance. I'd encourage you to click on that link to see exactly what they provide. Not only is the document lacking any insight about trends of the shape of the market, it's boring. Most people will look at the top 15 or 20, and then go down the list to find institutions they know and make some comparisons.
Extracting the data is difficult, and even when you do, it's laden with characters that should be stripped off or cleaned up due to footnotes and other caveats. Moreover, there is no ID number attached to the colleges (like an IPEDS ID) so you can't merge other information into it to get real insight (like endowment to operating budget ratios, for instance). Still, I did the best I could, then visualized it. It's below.
The top chart shows every university on two scales: 2014 Endowment value on the y-axis, and one-year percent change on the x-axis. They are duplicated on the bottom bar chart.
It gets fun when you use the filters: Eliminate the super-endowments, zoom in on big or small gains by dollar or percent; or use the regions to narrow the geographic view. (Note: One college had a 213% increase from 2013 to 2014. You can reveal it if you want by using the second filter. Pull the right handle all the way to the right.) You can't break it; I promise. But if you get stuck, you can always reset by clicking the small circular arrow at the bottom.
Comments
Post a Comment