It's the end of summer, so this is a quick and easy visualization, showing enrollment in 2013 by institution on a map. The data is provisional IPEDS data, so it's subject to some corrections, but the overall patterns won't change. It's probably obvious: Most colleges and universities are in populated areas, and so most college enrollment is too. But a few clicks can point out some interesting differences between and among the regions in the US.
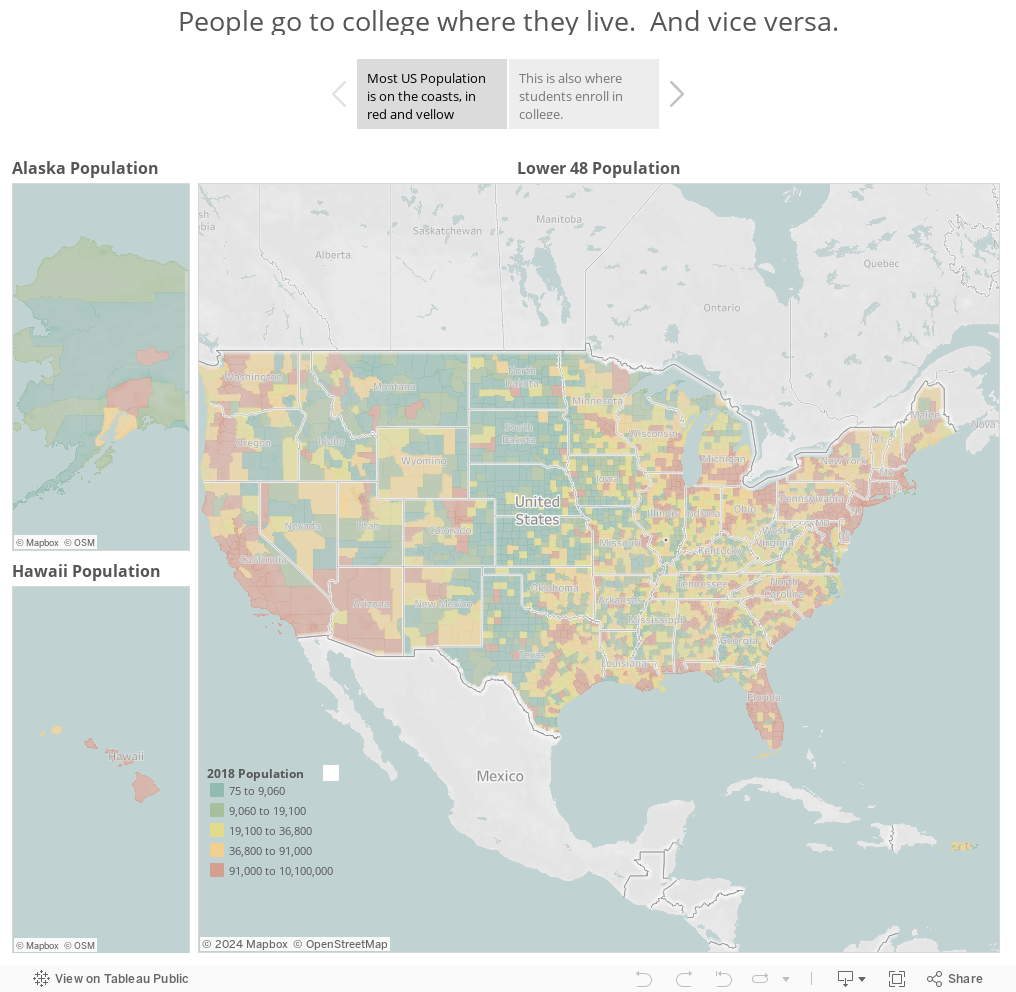
Take a look at the first map, showing the US population. Every county in the country is colored from green (low) to red (high) populations. It should come as no surprise that most of the US Population lives on or in the east coast, the midwest, and the west coast.
Now click on the tab at the top to to see where college students enroll, and you'll see a similar pattern: The orange and purple circles represent four-year public and private, not-for-profit institutions; the size of the circle is the relative enrollment.
You can use the control at the top right to show undergraduate, graduate, or total enrollments, and then you can filter the views down. Start with New England, for instance, and take note of the color and relative sizes of the enrollment. Then go somewhere else: The west coast, or the south, and see how the patterns change. Then try the same for graduate, and zoom around the country.
This raises an interesting question: How much of this correlation is due to putting colleges where people are, and how much is due to colleges attracting people to the city, state, or region where they live?
Comments
Post a Comment