
Yes, your yield rate is STILL falling, version 2022

We finally got the delayed 2022 admissions data from IPEDS yesterday, and I spent the better part of the evening working on pulling this together.  Counselors, parents, students, and admissions/enrollment management officers tell me this is a helpful tool to use while thinking about the state of college admission.

There are four views here:

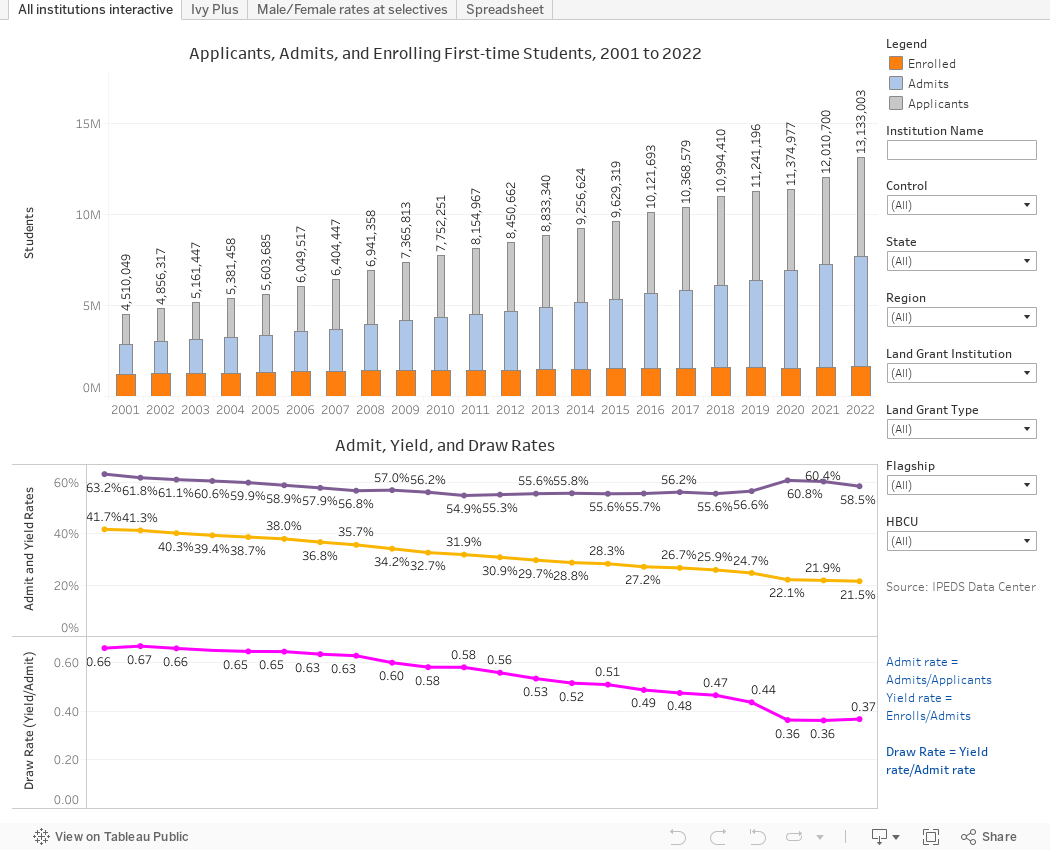
All institutions interactive shows admission data for all institutions who report it to IPEDS: The number of applications for the first-year class, the number of students offered admission, and the number who enrolled, shown on the bar charts at top.  Then, below, I've calculated admit rates, yield rates, and draw rates.  Admit rate is total admits/total applications; Yield rate is total enrolls/total admits.  And draw rate is yield/admit rate.

Draw rate is intended to show fake, artificially deflated admit rates.  I've written about this a lot, but essentially if you try to look more selective than you are by pumping up soft applications, you'll take a hit on yield.  I like Draw rate because it really helps sort out institutions at the top of the pecking order by looking beyond admit rates: The average industry draw is 0.37.  Meanwhile, Harvard is 25; Stanford is 22; Penn is 10; Northwestern is 7.6.  

Over time, the national draw rate has fallen, from 0.66 to 0.37.  At the Big 13 (second tab), it's gone from 3.0 to 14.  The race is over, folks.  

Use the filters at right to select single institutions or groups of colleges to see how things stacked up in 2022, and how they've changed over time.

The third view shows breakouts of male/female admit rates (IPEDS collects gender as binary, so that's their issue, not mine).  I selected institutions who had admit rates of less than 50% in 2022 and who received at least 1,500 applications.  Men are purple, women orange, and overall rates are shown in gray.

Finally, the last view shows the data in a spreadsheet format if you prefer.  Select the years you want, and groups for smaller selections.  I recommend no more than six years for the best view.

Some notes: There are always anomalies in IPEDS data, usually driven by mistakes in data submission or an inexperienced person filling out the form.  The data here is what IPEDS has.  And good luck with the Penn State data.  Up until 2019, the campuses reported separately.  Then in 2020 and 2021 they reported collectively, as The Pennsylvania State University.  And in 2022 we're back to the old method, apparently.  I'm not going to try to fix it.  Call them if you need the data in a format you can use.

Speaking of using, if you are a parent, student, or high school counselor, use this information widely and freely.  If you use it in your for-profit business, or if you use it to make points with your Board of Trustees at a college, you can support web hosting and software costs by buying me a coffee. Click here to do so.

Comments

Popular posts from this blog

Educational Attainment and the Presidential Elections

I've been fascinated for a while by the connection between political leanings and education: The correlation is so strong that I once suggested that perhaps Republicans were so anti-education because, in general, places with a higher percentage of bachelor's degree recipients were more likely to vote for Democrats. The 2024 presidential election puzzled a lot of us in higher education, and perhaps these charts will show you why: We work and probably hang around mostly people with college degrees (or higher).  Our perception is limited. With the 2024 election data just out , I thought I'd take a look at the last three elections and see if the pattern I noticed in 2016 and 2020 held.  Spoiler: It did, mostly. Before you dive into this, a couple of tips: Alaska's data is always reported in a funky way, so just ignore it here.  It's a small state (in population, that is) and it's very red.  It doesn't change the overall trends even if I could figure out how to c...

First-year student (freshman) migration, 2022

A new approach to freshman migration, which is always a popular post on Higher Ed Data Stories. If you're a regular reader, you can go right to the visualization and start interacting with it.  And I can't stress enough: You need to use the controls and click away to get the most from these visualizations. If you're new, this post focuses on one of the most interesting data elements in IPEDS: The geographic origins of first-year (freshman) students over time.  My data set includes institutions in the 50 states and DC.  It includes four-year public and four-year, private not-for-profits that participate in Title IV programs; and it includes traditional institutions using the Carnegie classification (Doctoral, Masters, Baccalaureate, and Special Focus Schools in business, engineering, and art/design. Data from other institutions is noisy and often unreliable, or (in the case of colleges in Puerto Rico, American Samoa, and other territories, often shows close to 100% of enro...

Education Levels in the US, by State and Attainment

Attainment has always been an interesting topic for me, every since I first got stunned into disbelief when I looked at the data over time.  Even looking at shorter periods can lead to some revelations that many don't make sense at first. Here is the latest data from NCES, published in the Digest of Education Statistics . Please note that this is for informational purposes only, and I've not even attempted to visualize the standard errors in this data, which vary from state-to-state.  There are four views year, all looking at educational attainment by state in 2012 and 2022.   The first shows data on a map: Choose the year, and choose the level of attainment.  Note that the top three categories can be confusing: BA means a Bachelor's degree only; Grad degree means at least a Master's (or higher, of course); and BA or more presumably combines those two.  Again, standard errors might mean the numbers don't always add up perfectly. The second shows the data o...