
Vacation Fun: The

I'm on vacation this week, and didn't plan to do anything on the blogs unless something really pressing came up.

Something really pressing came up. It borders on scandalous.

By now, you've probably heard that a certain university successfully trademarked the word "The."  How this happens, I have no idea; I'm not a lawyer (and that sound you hear is all the lawyers saying, "no kidding.")  But it happened.

And that's not the really pressing thing, nor is it the scandalous thing.  But follow along.

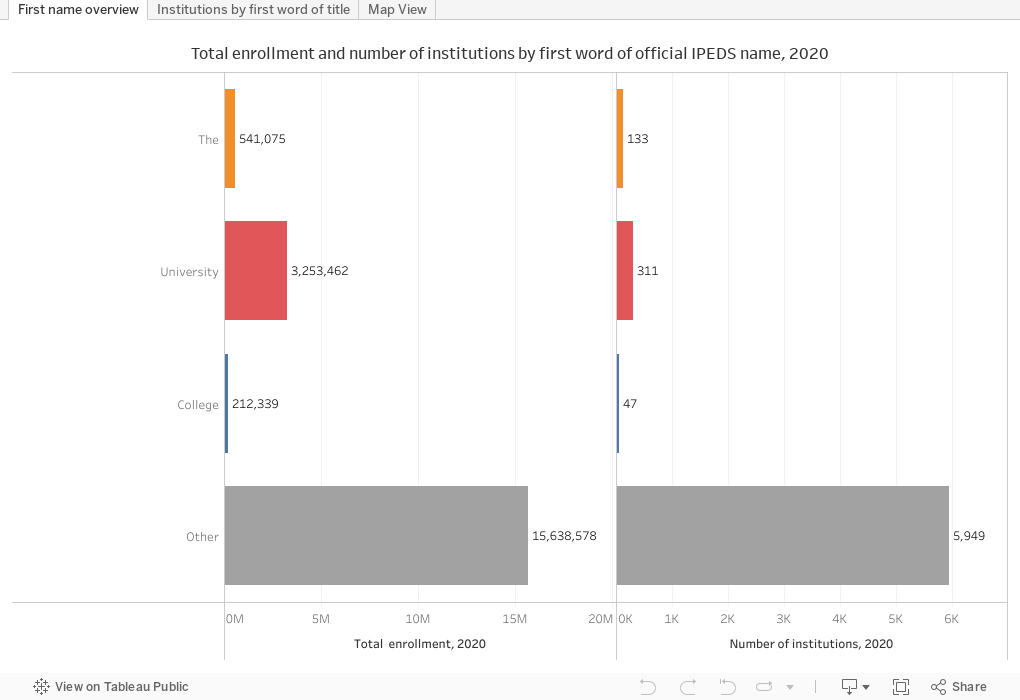
The news bothered me and others on Twitter, so I felt compelled to take a look at university names, specifically the first word of their names, using official designations in IPEDS.  I broke this into three categories: Those whose names started with "The," those whose names started with "University," and those whose names started with "College," plus the category of "Other."

My thinking was that there are already many colleges, with substantial enrollment, who already use the word "The" at the beginning of their name who could have and should have protested this; there are also many who start out with "University" who might be tempted in casual conversation to throw a "The" at the start and are now afraid of being sued; the same for any place called "College." 

As you will see, most college and university enrollment (total graduate and undergraduate) falls into the "Other" category; this includes enrollment at places like Kansas State University (begins with "Kansas") or the four that start with "Loyola" or the twelve that start with "Concordia."  

Then comes "University," followed by "The" followed by "College."

You can explore on these three charts below, using the filters if you wish.

Guess which university you won't find on the "The" list?  


Anyway, I'm on vacation.  

Comments

Popular posts from this blog

Educational Attainment and the Presidential Elections

I've been fascinated for a while by the connection between political leanings and education: The correlation is so strong that I once suggested that perhaps Republicans were so anti-education because, in general, places with a higher percentage of bachelor's degree recipients were more likely to vote for Democrats. The 2024 presidential election puzzled a lot of us in higher education, and perhaps these charts will show you why: We work and probably hang around mostly people with college degrees (or higher).  Our perception is limited. With the 2024 election data just out , I thought I'd take a look at the last three elections and see if the pattern I noticed in 2016 and 2020 held.  Spoiler: It did, mostly. Before you dive into this, a couple of tips: Alaska's data is always reported in a funky way, so just ignore it here.  It's a small state (in population, that is) and it's very red.  It doesn't change the overall trends even if I could figure out how to c...

First-year student (freshman) migration, 2022

A new approach to freshman migration, which is always a popular post on Higher Ed Data Stories. If you're a regular reader, you can go right to the visualization and start interacting with it.  And I can't stress enough: You need to use the controls and click away to get the most from these visualizations. If you're new, this post focuses on one of the most interesting data elements in IPEDS: The geographic origins of first-year (freshman) students over time.  My data set includes institutions in the 50 states and DC.  It includes four-year public and four-year, private not-for-profits that participate in Title IV programs; and it includes traditional institutions using the Carnegie classification (Doctoral, Masters, Baccalaureate, and Special Focus Schools in business, engineering, and art/design. Data from other institutions is noisy and often unreliable, or (in the case of colleges in Puerto Rico, American Samoa, and other territories, often shows close to 100% of enro...

Education Levels in the US, by State and Attainment

Attainment has always been an interesting topic for me, every since I first got stunned into disbelief when I looked at the data over time.  Even looking at shorter periods can lead to some revelations that many don't make sense at first. Here is the latest data from NCES, published in the Digest of Education Statistics . Please note that this is for informational purposes only, and I've not even attempted to visualize the standard errors in this data, which vary from state-to-state.  There are four views year, all looking at educational attainment by state in 2012 and 2022.   The first shows data on a map: Choose the year, and choose the level of attainment.  Note that the top three categories can be confusing: BA means a Bachelor's degree only; Grad degree means at least a Master's (or higher, of course); and BA or more presumably combines those two.  Again, standard errors might mean the numbers don't always add up perfectly. The second shows the data o...