Now that almost every university in the nation has gone test-optional for the 2021 cycle out of necessity, a nagging question remains: How many will go back to requiring tests as soon as it's possible? No one knows, but some of the announcements some colleges made sounded like the kid who only ate his green beans to get his screen time: They did it, but they sure were not happy about it. So we have some suspicions about the usual suspects.
I don't object to colleges requiring tests, of course, even though I think they're not very helpful, intrinsically biased against certain groups, and a tool of the vain. You be you, though, and don't let me stop you.
However, there is a wild card in all of this: The recent court ruling prohibiting the University of California system from even using--let alone requiring--the SAT or ACT in admissions decisions next fall. If you remember, the Cal State system had already decided to go test blind, and of course community colleges in the state have never required tests. When combined with the previous announcements about the UC plans, the state of Oregon going permanently test-optional, and Washington not far behind, we may never see another test requirement at public university on the west coast.
A lot of people have no sense of the size of California. Los Angeles county has more residents than 43 of the US states. About one out of every eleven college students in the US goes to college at a California Community College. About 10% of all students in the US enrolling as a freshman in a four-year college in the US in 2018 came from California. It's a big deal.
And California is a big deal for colleges outside of California, too. In 2018, over 36,000 California students attended over 1,200 four-year colleges nationwide. Another 135,000 stayed in state at four-year colleges.
And if most of them don't need a standardized test, guess what? They're going to start wondering why they should take it if they want to consider going out-of-state. But you're going to require them for your applicants? I wouldn't want to be a private university in California or a neighboring state and make the switch back.
A few places will be able to get by with it. You probably won't. Let's go to the data, shall we?
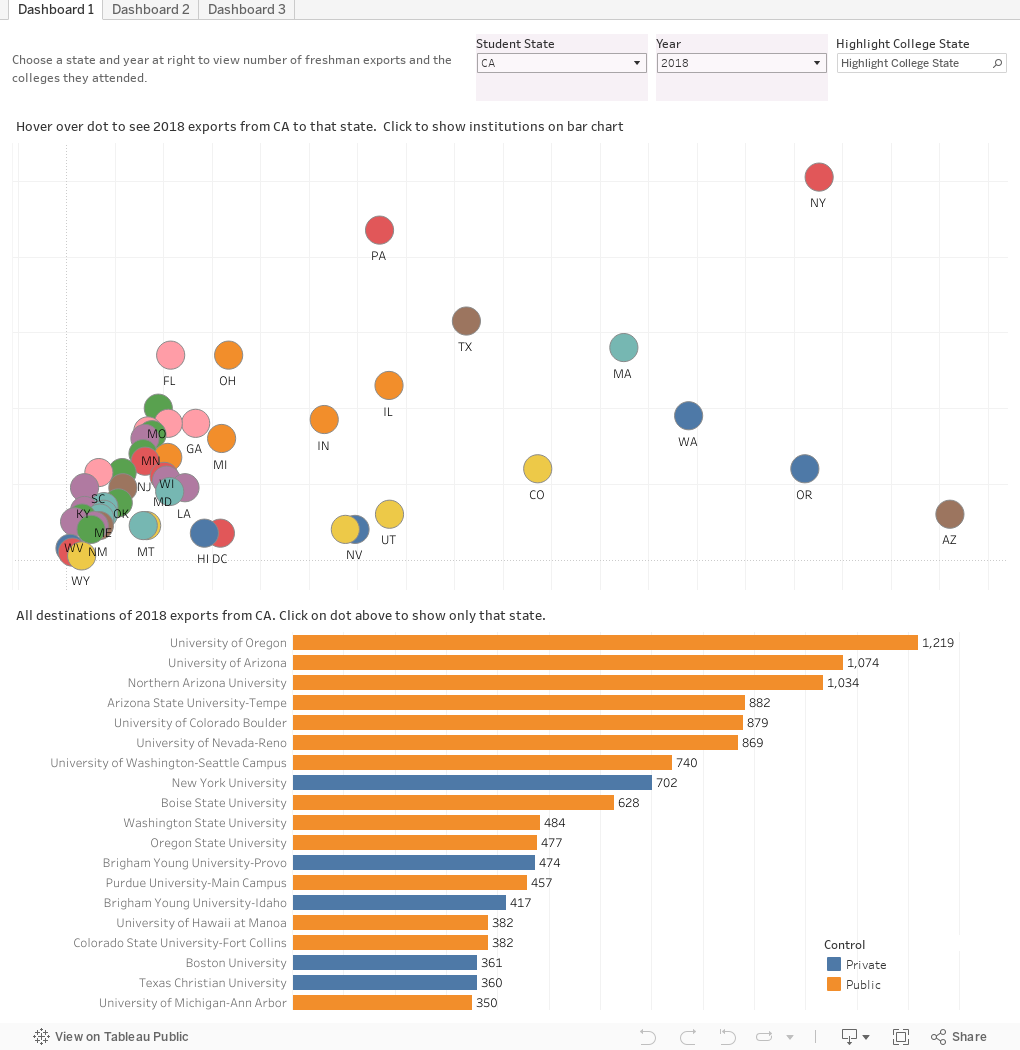
This is a pretty simple visualization. It starts with California exports, and shows the number of students leaving California to go to each state, all of which are arrayed on two scales: How many students from California enrolled, and how many colleges they enrolled in. Hover over a dot to see the details. Click on the dot to see which colleges enrolled how many students in 2018 (or any year you select). Use the highlighter to find your state.
As you look at this view, notice the big destinations for California students, and note how many of them are permanently test-optional, too. That's going to depress test takers, and thus test centers, even more, I believe.
Now, click on another state using the filter. Try Massachusetts, for instance. Notice how many Massachusetts students go to California, and how many of those attend public universities. See the trickle effect?
It will be interesting. If you think you want to go back to tests as soon as you can, ask yourself this: Is my university's market position strong enough to demand them? Even if there are far fewer test centers? And if it is, can I lose some substantial percentage of my California applications and maintain that other vanity value, selectivity?
I know EM people don't always make this call, but you should be leading discussions like this on your campus. Your job may depend on it. Start with the numbers, and go from there.
Note: I almost never do requests, but I did add two views to this, based on a comment I received. Dashboard two shows the colleges outside of California with at least 200 freshmen from the state in 2018; Dashboard three shows the colleges outside of California with at least 10% of their freshman class from the state.
Reminder: I appreciate support for webhosting and other costs associated with creating Higher Ed Data Stories. You can support these efforts here.
Comments
Post a Comment