
Yes, your yield rate is still falling


In 2015, I wrote this post on falling yield rates.  It was pretty obvious to many of us in the profession that this trend was widespread, and largely driven by a dramatic increase in applications against a more modest increase in actual students who could or would enroll.

It apparently wasn't so obvious to everyone.  Response was much stronger than I thought it would be, and I never had seen so many requests from people who wanted to share it with their trustees (btw, this is public; you never have to ask permission to share).

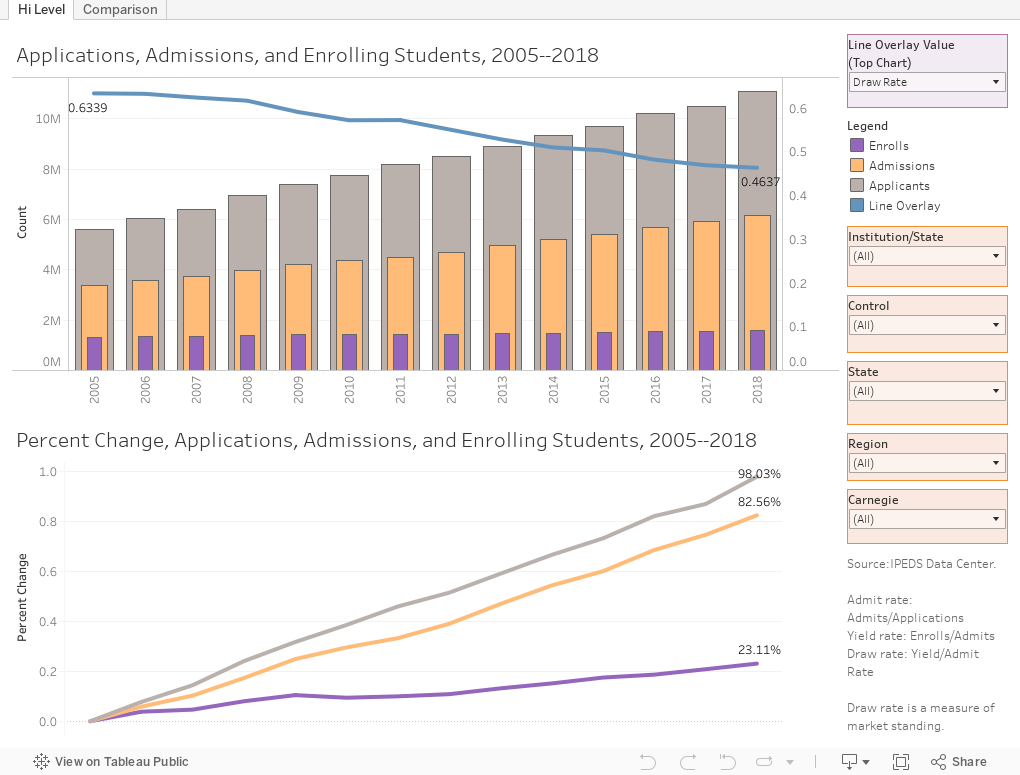
So I redid it, using trend data from 2005 to 2018.  First a couple of definitions:


  • Admit rate is the percentage of applicants who were offered admission (admits/applicants).
  • Yield rate is the percentage of admitted students who enroll (enrollers/admits).
  • Draw rate is not commonly known, and I wish I remember who first mentioned it to me in the 1980's.  It stuck with me and is a valuable metric, I think, as we attempt to measure market position.  It's Yield Rate/Admit Rate, and it sorts out the super-selective places even within the category.  For example, The Average Draw Rate is about .46; Stanford's is 18, and Dartmouth's is about 7.  It's intended to punish institutions who artificially inflate application numbers to appear to be more selective, as yield usually drops when you do that.  Of course, now many colleges manipulate this (even if they don't know it) by using ED, ED2, EA, etc. to drive yield higher.
  • The universe is about 2,000 four-year public and private, not-for-profit institutions that report admissions data to IPEDS.  Open admissions institutions are not required to do so.
There are just two views on this.  The first shows two charts.  On the top, you see the total applications, admits, and enrolling students over time.  Use the control at top right (purple box) to change the value on the blue line to show admit, yield, or draw, as you like.  The bottom chart shows the percentage increase since 2005 of those same numbers.

If you don't want to look at the whole universe, use the filters (orange boxes).  You can choose any subset of institutions you wish: Public institutions in the Southeast, for instance; or Doctoral institutions; or even a single institution if that's what you want.

The second tab (across the top) is for Enrollment people or anyone who wants to compare one institution to another.  Choose your focus institution on the top chart (Boston University is the starting value, but you can choose any institution); then create a comparison group on the bottom chart.  For instance, Michigan State might want to compare itself to Land Grant Universities in the Great Lakes Region.  Three clicks is all it takes.  Highlight the year to, well, highlight a specific year.

Let me know what you think, and, of course feel free to share with others at your institution.  This may answer a lot of "what" questions, and maybe a few "why" questions, but the answers don't always provide insight.

That's what they pay you for.


Comments

Popular posts from this blog

Changes in AP Scores, 2022 to 2024

Used to be, with a little work, you could download very detailed data on AP results from the College Board website: For every state, and for every course, you could see performance by ethnicity.  And, if you wanted to dig really deep, you could break out details by private and public schools, and by grade level.  I used to publish the data every couple of years. Those days are gone.  The transparency The College Board touts as a value seems to have its limits, and I understand this to some extent: Racists loved to twist the data using single-factor analysis, and that's not good for a company who is trying to make business inroads with under-represented communities as they cloak their pursuit of revenue as an altruistic push toward access. They still publish data, but as I wrote about in my last post , it's far less detailed; what's more, what is easily accessible is fairly sterile, and what's more detailed seems to be structured in a way that suggests the company doesn...

Educational Attainment and the Presidential Elections

I've been fascinated for a while by the connection between political leanings and education: The correlation is so strong that I once suggested that perhaps Republicans were so anti-education because, in general, places with a higher percentage of bachelor's degree recipients were more likely to vote for Democrats. The 2024 presidential election puzzled a lot of us in higher education, and perhaps these charts will show you why: We work and probably hang around mostly people with college degrees (or higher).  Our perception is limited. With the 2024 election data just out , I thought I'd take a look at the last three elections and see if the pattern I noticed in 2016 and 2020 held.  Spoiler: It did, mostly. Before you dive into this, a couple of tips: Alaska's data is always reported in a funky way, so just ignore it here.  It's a small state (in population, that is) and it's very red.  It doesn't change the overall trends even if I could figure out how to c...

Changes in SAT Scores after Test-optional

One of the intended consequences of test-optional admission policies at some institutions prior to the COVID-19 pandemic was to raise test scores reported to US News and World Report.  It's rare that you would see a proponent of test-optional admission like me admit that, but to deny it would be foolish. Because I worked at DePaul, which was an early adopter of the approach (at least among large universities), I fielded a lot of calls from colleagues who were considering it, some of whom were explicit in their reasons for doing so.  One person I spoke to came right out at the start of the call: She was only calling, she said, because her provost wanted to know how much they could raise scores if they went test-optional. If I sensed or heard that motivation, I advised people against it.  In those days, the vast majority of students took standardized admission tests like the SAT or ACT, but the percentage of students applying without tests was still relatively small; the ne...